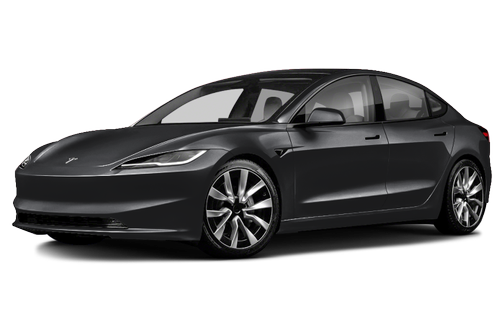
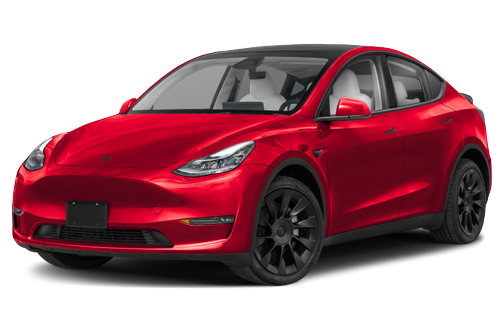


Now celebrating its 20th year of publication, Cars.com’s American-Made Index has once again ranked all qualifying vehicles built and bought in the U.S. for model-year 2025. The results at the top may not be surprising — Tesla’s Model 3 sedan returns to the top spot after abdicating in deferment to the Model Y SUV for 2024 — but as happens every year, movement throughout the index reveals a number of developing stories in the automotive industry.
Related: Which Cars Are Made Outside the U.S.?
Our study determines the order via the same criteria as it’s been since 2020 (about which more below). Some 400 vehicles of model-year 2025 vintage were analyzed to qualify the vehicles that ultimately made the full list of 99, which can be found above and in badges around the Research section of our site.
Related Video:
Tesla Again Atop the Automotive Tumult
Despite the uncertainty automakers face with the Trump administration’s mercurial tariffs and the discussion concerning supply-chain shifts and reshoring, what the index shows for 2025 is how glacial that process really is.
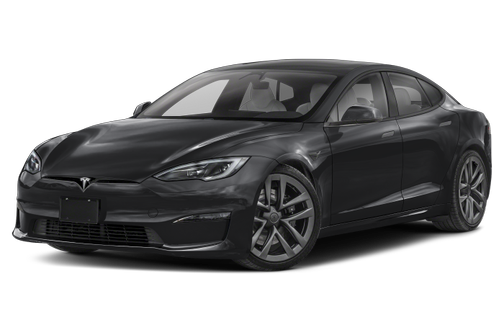
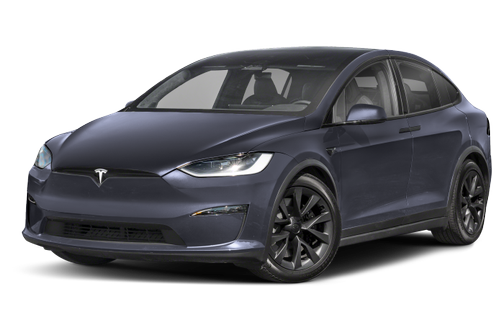
To wit: Since Texas-based all-electric marque Tesla started participating in the American-Made Index in 2020, its vehicles have consistently ranked in the top 10, and for the second time (the first was in 2023), its four light-duty passenger vehicles have swept the top spots — led by the nameplate that a year ago ranked lowest among its brand brethren. It’s not just that these vehicles feature a high percentage of U.S./Canadian parts content or major components assembled here in the U.S.; it’s also the fact that they have so many people building these cars. The manufacturing workforce component, explained in more detail below, always plays a major role in our rankings, but this year it was a decisive factor in Tesla’s dominance atop the index.
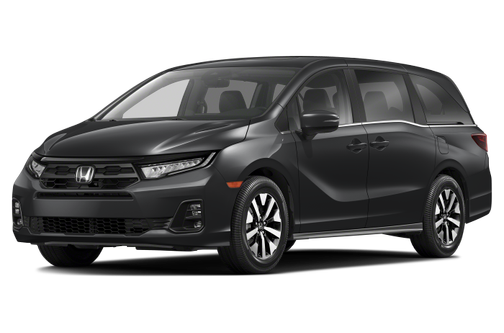
Another common presence toward the top of our rankings in recent years has been Honda, and 2025 is no different. The Alabama-made Ridgeline pickup truck and Odyssey minivan have consistently been in the top 10 since 2017, the Passport SUV since 2019; their consistently high domestic parts content percentages and U.S.-assembled componentry ensure a steady presence at the top of the list. Jeep’s Gladiator pickup, rolling off assembly lines in Toledo, Ohio, and Volkswagen’s ID.4, assembled in Chattanooga, Tenn., also return to the top 10.
A new name graces the AMI’s top 10 for the first time this year, however, and its presence suggests a shift we’ve long been talking about in the car world. The Kia EV6 SUV features the highest U.S./Canadian parts content percentage of any vehicle sold in America today at 80%. Combined with production moving from South Korea to Kia’s West Point, Ga., plant, the EV6 doesn’t just herald the arrival of a new name to the list, it also marks the first time all-electric vehicles have been the majority of the top 10. After only eight EVs qualified for 2024, 11 are present on the 2025 list, with a further 19 hybrids and plug-in hybrids (up from 15 total in 2024) demonstrating the industry’s push for electrification wasn’t mere lip service. How steady that presence will be moving forward in the face of potential rescinding of the federal EV tax credits and price hikes to shoppers remains to be seen, but the gradual diversification of powertrains in our index continues slowly apace for another year.

How Does the AMI Get Made?
Small changes to account for fresh scenarios aside, the AMI’s basic methodology remains unchanged for 2025. We consider five major factors:
- Location(s) of final assembly
- Percentage of U.S. and Canadian parts
- Countries of origin for all available engines
- Countries of origin for all available transmissions
- U.S. manufacturing workforce
While we don’t reveal the weighting and calculation methodology, each factor is essential, as are a number of disqualifiers explained below. Models are ranked on a 100-point scale, with heavier curb weights functioning as a tiebreaker when necessary.
Final assembly location(s)
Arguably the most important factor for index qualification is final assembly at one of 46 U.S. plants run by 13 major automaker groups and their subsidiaries that currently mass-produce light-duty passenger vehicles. (We adopt the Federal Highway Administration’s definition of light-duty vehicles, which allows for up to 10,000 pounds’ gross vehicle weight rating. This classification is separate from the EPA’s classification system, which rates light-duty vehicles up to 8,500 pounds and is why heavy-duty trucks like the Tesla Cybertruck and Rivian R1T don’t get fuel-economy ratings or more detailed assembly information.) But automakers run scores of additional plants for powertrains, castings, stampings, batteries and other vehicle parts, while third-party suppliers run additional facilities beyond that. And just because a model may be made in a U.S. assembly plant doesn’t necessarily mean it’s exclusively made here. We account for that with scoring reductions for imported volume.
Percentage of U.S. and Canadian parts
This component employs data from the American Automobile Labeling Act, which has been in effect since 1994 and requires automakers to report the overall percentage of U.S. and Canadian content, by value, for most vehicles they sell. Some automakers report a single percentage per nameplate; others break out unique percentages by powertrain, trim level or assembly location. In such cases, the AMI employs sales-weighted averages for the score.
Combining Canadian and U.S. parts content is a flaw we can’t reverse-engineer, but a clear advantage is that unlike other systems rating domestic automotive content — such as calculations for regional value content under trade agreements or delineations for import versus domestic cars in fuel-economy mandates — the AALA makes this information more legible to the consumer. The act requires automakers disclose this percentage on window stickers or nearby placards for most new vehicles not yet sold. While automakers don’t furnish U.S. versus Canadian parts content and public data don’t exist to distinguish each, we compensate by factoring in engine and transmission origins to more accurately identify two major cost-intensive components of each vehicle.
Countries of origin for available engines
The AALA mandates automakers report the country of origin for all available engines and transmissions, but it can get complex — a nameplate might have one available engine from one country but another from a different country, or an EV might feature the same battery option otherwise indistinguishable to the consumer that’s sourced from two different countries. As with U.S. and Canadian parts content, the AMI applies sales-weighted scoring to account for the variances.
Countries of origin for available transmissions
The process is the same for transmissions, another AALA requirement. Here, too, the index applies weighted scores as needed.
U.S. manufacturing workforce
The AALA doesn’t focus on labor value, especially in a vehicle’s final assembly. Thus, we analyze each automaker’s direct U.S. workforce involved in the manufacture of light-duty vehicles and their parts, factored against that automaker’s U.S. output relative to the industry, to determine its workforce factor.
There are disqualifying factors, as well. Regardless of assembly location, these vehicles are ineligible:
- Models with a gross vehicle weight rating above 8,500 pounds — mostly full-size vans, three-quarter- and 1-ton pickup trucks, and larger commercial vehicles — which are exempt from AALA requirements.
- Models from automakers that build fewer than 1,000 cars in a given model year. Such cars are exempt from certain AALA requirements.
- Models set for imminent discontinuation, or production moving outside the U.S., without a clear U.S.-built successor.
- Models not yet on sale at the time of the study (in this case, spring 2025) even if they’re from the current model year.
- Models intended solely for government or commercial fleets.
- Models that don’t meet minimum sales or inventory thresholds. (Such thresholds cover roughly 98% of all passenger vehicle sales, so exclusions here are minimal.)
- Models for which we cannot verify sufficient information from automakers, dealership audits, Cars.com inventory and government records.
This year’s study draws on data from the National Highway Traffic Safety Administration, all major automakers and Automotive News, as well as analyses of more than 173,000 vehicles in Cars.com inventory and in-person audits of around 450 dealer vehicles.
A given model under AMI consideration includes all variants under the root nameplate unless they’re substantially electrified or use separate platforms. (We judge milder hybrid applications as acceptable to fold into the parent vehicle’s ranking.)
Under our platform rule, vehicles like the Ram 1500 and erstwhile Ram 1500 Classic are separate AMI entrants due to their different underlying architecture. By contrast, vehicles with different root nameplates are always distinct regardless of the architecture; the Chevrolet Colorado and GMC Canyon pickups have almost identical underpinnings, but since they have different names, they’re listed separately.
How Does My Unranked Car Count?
At No. 99, the Toyota RAV4 Hybrid rounds out our rankings for 2025, but that’s just scratching the surface of the automotive industry. Among the 400 light-duty models automakers sell (or plan to) in the U.S. for the 2025 model year, 133 are made solely in the U.S.; 248 are imported; and 19 are split between domestic and imported assembly lines.
Such imports and unranked domestics DQ’d on other AMI grounds significantly contribute to the economy beyond the 302,000-plus jobs that built light- and heavy-duty vehicles stateside in 2024. Think of the nearly 559,000 additional jobs involving vehicle parts or the more than 1.3 million jobs that are employed in dealership operations both for new and used vehicles. That alone is employment in the car-shopping realm totaling nearly 2.2 million.
Then think of the maintenance work required to keep those cars on the road. That includes 1.28 million jobs at independent repair shops; nearly 605,000 jobs attributable to auto parts, accessories and tire stores; 387,000 jobs at wholesalers that include auction houses; and nearly a million jobs at gas stations. Ultimately, whether your car is assembled in the U.S. or imported from abroad, driving and servicing it helps contribute to an automotive industry that puts food on the table for over 5.4 million workers.
Cars.com’s Editorial department is your source for automotive news and reviews. In line with Cars.com’s long-standing ethics policy, editors and reviewers don’t accept gifts or free trips from automakers. The Editorial department is independent of Cars.com’s advertising, sales and sponsored content departments.


