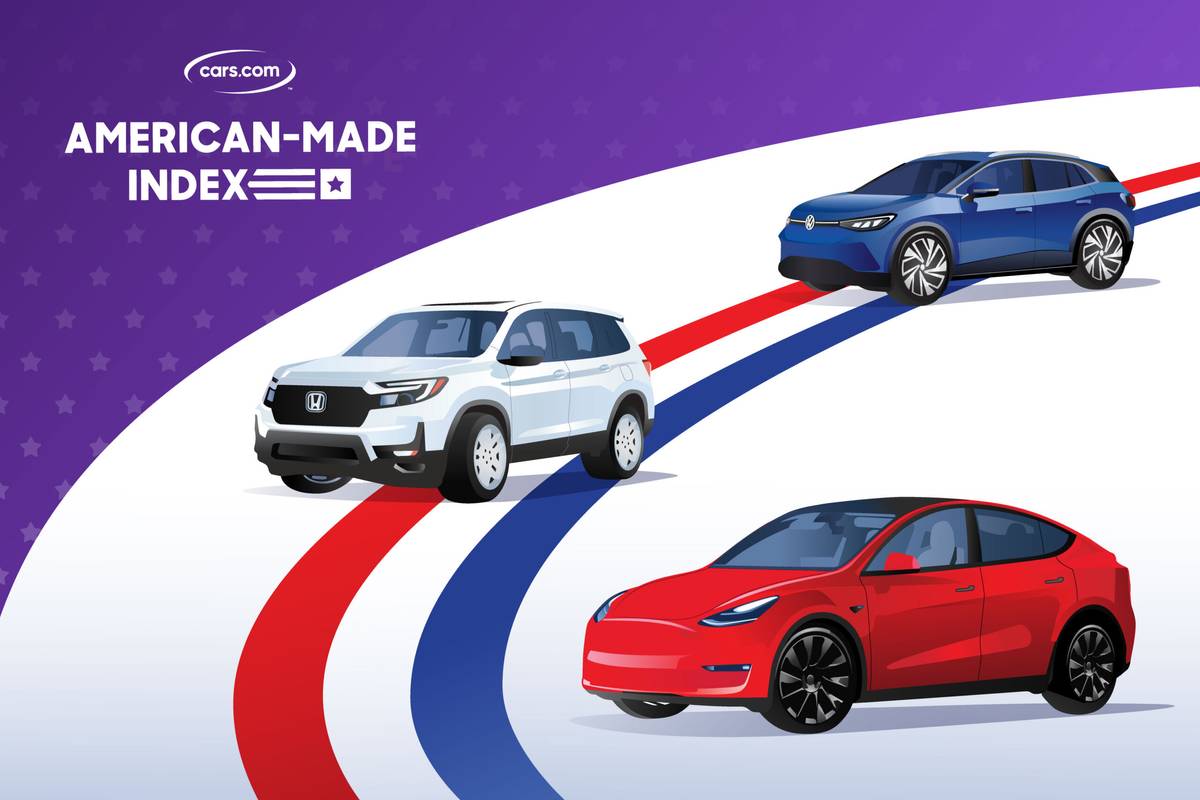
2024 Cars.com American-Made Index: Which Cars Are the Most American?


A familiar name sits atop Cars.com’s American-Made Index for 2024, as the Tesla Model Y claims the No. 1 overall ranking for a third consecutive year, but it’s all changed from there. Following a sweep of the index with its lineup for 2023, Tesla’s cars are broken up in the list by models both new and familiar as the index hits its 19th year ranking vehicles built and bought in the U.S.
Related: 2024 Cars.com American-Made Index: What About the Least American Cars?
Our study ranks 100 vehicles judged through the same five criteria as it’s been since the 2020 edition: assembly location, parts content, engine origin, transmission origin and U.S. manufacturing workforce. More than 400 vehicles of model-year 2024 vintage were analyzed to qualify the 100 vehicles on the list.
The top 10 shifts considerably thanks largely to Tesla. The Texas-based all-electric automaker locked out the top four in the 2023 index, but its Model S sedan and Model X SUV come in at Nos. 4 and 9 this year, and noticeably absent from the top 10 is a vehicle that once ranked No. 1 outright in 2021: the Model 3 sedan. On the receiving end of these drops are Honda, whose Passport SUV now lands at No. 2, plus its Odyssey minivan and Ridgeline pickup truck at Nos. 5 and 6, respectively; Volkswagen, whose ID.4 electric vehicle ranks No. 3; Toyota and its luxury brand Lexus, with the Camry sedan and all-new TX SUV at Nos. 7 and 10, respectively; and Jeep, whose Gladiator rises to No. 8 this year.
So, what changed? And what about the other 90 vehicles? Read on to find out.
All cars above are ranked for the 2024 model year, with assembly locations current as of May 2024. For nameplates that include both gas-only and substantially electrified versions (e.g., Ford F-150, F-150 hybrid and F-150 Lightning), each variant is rated separately.
Though Teslas no longer hold a vice grip at the top of the order thanks in part to changes in this year’s workforce calculations, it’s worth noting the Model X has the same overall U.S. and Canadian parts content as it did for 2023, and the Model S has 5% more; only the Model 3 saw a drop in overall parts content percentage. Even so, the Model 3 features a variant with 75% U.S. and Canadian parts content — a requirement of the original AMI only one other vehicle managed for 2024.
That vehicle, the Passport, comes from Honda, whose steadfast U.S. production approach continues to pay dividends in AMI rankings. Looking beyond the Alabama-built Passport, Odyssey and Ridgeline, a glut of Honda and Acura models hovers just outside the top 10, including the Accord and Pilot, as well as Acura’s RDX, MDX, Integra and TLX; indeed, every model-year ‘24 Acura sold for U.S. roads is made in Ohio except the all-electric ZDX (which, thanks to a fleeting agreement with GM, is still a U.S. product from the latter’s Spring Hill, Tenn., plant).
Once a perennial AMI frontrunner, Toyota returns to the top 10 this year with the Camry (ranked No. 1 under different methodologies from 2009-12 and 2015-16) and brand-new Lexus TX SUV. Like the Toyota Highlander it just beats out for the 10 spot, the TX is made in Princeton, Ind., and though its hybrid and plug-in hybrid variants missed out on qualifying this year thanks to insufficient sales data, its parts content mix and all-American powertrain production suggest the TX will be a prominent AMI fixture for the foreseeable future.
Volkswagen and Jeep each have figured prominently in past indices; the latter even ranked first overall from 2017-19. But amid the swirl of Teslas, Hondas and Toyotas, these two outliers clearly belong for similar reasons: For VW, moving ID.4 production from Germany, where it began, to its Chattanooga, Tenn., plant alongside the Atlas and Atlas Cross Sport helped it rocket to the top 10 in 2023, and a higher U.S. and Canadian parts content mix for 2024 aids it further. For the Gladiator, discontinuing the Italian-built turbo-diesel 3.0-liter engine may have rankled some, but filling the void are some U.S.-made 3.6-liter engines that were once made solely in Mexico; together with an uptick in domestic parts content, that made a big difference.
Related Video:
Snapshot of a Slowed Shift
A recent Cars.com survey found 56% of in-market shoppers want to buy American-made vehicles, and more than half were willing to pay 10% or more over their planned budget if it meant keeping jobs stateside. With the economy and inflation at the top of shoppers’ minds as an election looms (in a Cars.com survey of the general population, 74% said they’re spending less money than they were the same time in 2023), where a vehicle gets made can be just as crucial a factor in the purchase process as how much it costs.
Both factors, however, are affected by what’s decided from the top. In May, President Joe Biden announced steeper tariffs on a number of Chinese imports essential to the auto industry (e.g., semiconductors, batteries and critical minerals) in an effort to bolster U.S. manufacturing. Should those tariffs change in the wake of the upcoming presidential election, or should China retaliate with higher tariffs of its own, automakers may need to shift their supply chains — not to mention their vehicle lineups. How much a vehicle costs to get made may be just as crucial a factor in the manufacturing process as where it’s made.
Perhaps most susceptible to such changes will be EVs. Though it’s been a good year to buy an EV, with more inventory and variety than ever, repeated delays, late rollouts of new models and underperforming sellers means only eight all-electrics qualify for the list this year, same as in 2023. Similarly, hybrids are only up one in total over the ‘23 index (13 versus 12), and plug-in hybrids remain unchanged, at two. Automakers’ plans often take years to execute, and what you see above is a snapshot of an industry amid a major transition. Toyota’s battery-manufacturing plant in North Carolina is expected to come online in 2025; Polestar is nearing production of its 3 electric SUV in South Carolina; every Chevrolet Corvette, E-Ray or no, is still made in Bowling Green, Ky.; Stellantis still plans to pour $155 million into three Indiana plants as part of its electrification efforts. But how far-reaching that transition is may yet shift again. For another year, at least, it’s clear that while EVs feature at the top of the AMI, softened consumer demand has resulted in internal combustion engines still ruling the roost when it comes to overall domestic manufacturing output.
How Does the AMI Get Made?
A few minor tweaks to account for fresh scenarios aside, the AMI’s basic methodology remains unchanged for 2024. We consider five major factors:
- Location(s) of final assembly
- Percentage of U.S. and Canadian parts
- Countries of origin for all available engines
- Countries of origin for all available transmissions
- U.S. manufacturing workforce
While we don’t reveal the weighting and calculation methodology, each factor is essential, as are a number of disqualifiers explained below. Models are ranked on a 100-point scale, with heavier curb weights functioning as a tiebreaker when necessary.
Final assembly location(s)
Perhaps the most important factor for index qualification is final assembly at one of 46 U.S. plants run by 14 major automaker groups and their subsidiaries that currently mass-produce light-duty passenger vehicles. (We adopt the Federal Highway Administration’s definition of light-duty vehicles, which allows for up to 10,000 pounds’ gross vehicle weight rating. Note that this classification is separate from the EPA’s classification system, which rates light-duty vehicles up to 8,500 pounds and is why heavy-duty trucks don’t get fuel-economy ratings or more detailed assembly information.) But automakers run scores of additional plants for powertrains, castings, stampings, batteries and other vehicle parts, while third-party suppliers run additional facilities beyond that. And just because a model may be made in a U.S. assembly plant doesn’t necessarily mean it’s exclusively made here. We account for that with scoring reductions for imported volume.
Percentage of U.S. and Canadian parts
This component employs data from the American Automobile Labeling Act, which has been in effect since 1994 and requires automakers to report the overall percentage of U.S. and Canadian content, by value, for most vehicles they sell. Some automakers report a single percentage per given model sold; others break out unique percentages by powertrain, trim level or assembly location. In such cases, the AMI employs sales-weighted averages for the score.
Combining Canadian and U.S. parts content is a flaw we can’t reverse-engineer, but a clear advantage is that unlike other leading systems rating domestic automotive content — e.g., calculations for regional value content under trade agreements or delineations for import versus domestic cars in fuel-economy mandates — the AALA makes this information more legible to the consumer. The act requires automakers disclose this percentage on window stickers or nearby placards for most new vehicles not yet sold (though we’ve come across dealerships that don’t comply).
While automakers don’t furnish U.S. versus Canadian parts content and public data don’t exist to distinguish each, we compensate by factoring in engine and transmission origins to more accurately identify two major cost-intensive components of each vehicle.
Countries of origin for available engines
The AALA mandates automakers report the country of origin for all available engines and transmissions, but it can get complex — a nameplate might have one available engine from one country but another from a different country, or an EV might feature the same battery option otherwise indistinguishable to the consumer that’s sourced from two different countries. As with U.S. and Canadian parts content, the AMI applies sales-weighted scoring to account for the variances.
Countries of origin for available transmissions
The process is similar for transmissions, another AALA requirement. For example, the same transmission can come from one or another country, depending on the car. Here, too, the index applies weighted scores as needed.
U.S. manufacturing workforce
The AALA doesn’t focus on labor value, especially in a vehicle’s final assembly. Thus, we analyze each automaker’s direct U.S. workforce involved in the manufacture of light-duty vehicles and their parts, factored against that automaker’s U.S. output relative to the industry, to determine its workforce factor.
There are factors that can disqualify a vehicle, too. Regardless of assembly location, these vehicles are ineligible:
- Models with a gross vehicle weight rating above 8,500 pounds — mostly full-size vans, three-quarter- and 1-ton pickup trucks, and larger commercial vehicles — which are exempt from AALA requirements.
- Models from automakers that build fewer than 1,000 cars in a given model year. Such cars are exempt from certain AALA requirements.
- Models set for imminent discontinuation, or production moving outside the U.S., without a clear U.S.-built successor.
- Models not yet on sale at the time of the study (in this case, spring 2024) even if they’re from the current model year.
- Models intended solely for government or commercial fleets.
- Models that don’t meet minimum sales or inventory thresholds. (Such thresholds cover roughly 98% of all passenger vehicle sales, so exclusions here are minimal.)
- Models for which we cannot verify sufficient information from automakers, dealership audits, Cars.com inventory and government records.
Among FHWA light-duty vehicles fully assembled in the U.S., the above disqualifications knocked the below model-year 2024 vehicles off the list:
- Acura ZDX; BMW XM; Buick Envista; Cadillac Celestiq and CT4; Chevrolet Camaro, Express, Silverado HD and Traverse Limited; Faraday Future FF 91; Fisker Ocean; Ford F-Series Super Duty, Police Interceptor Utility, Ranger and Transit; GMC Hummer EV Pickup, Hummer EV SUV, Savana and Sierra HD; Honda Prologue; Kia K5; Lexus ES; Lucid Air; Mercedes-Benz GLE, Sprinter and Mercedes-EQ EQS SUV; Nio ET7; Nissan Leaf and Titan; Ram 2500, 3500 and ProMaster; Rivian R1S and R1T; Tesla Cybertruck; VinFast VF 3, 6, 7 and Wild; and Polestar 3
- Electric or PHEV versions of the BMW X5; Chevrolet Corvette and Silverado; GMC Sierra; Lexus ES and TX; Lincoln Corsair; Mercedes-Benz Sprinter; Ram ProMaster; Toyota Tacoma; and Volvo S60
This year’s study draws on data from the National Highway Traffic Safety Administration, all major automakers and Automotive News, as well as analyses of approximately 165,000 vehicles in Cars.com inventory and in-person audits of more than 700 dealer vehicles.
A given model under AMI consideration includes all variants under the root nameplate unless they’re substantially electrified or use separate platforms. For example, the Jeep Wagoneer includes the Jeep Grand Wagoneer L — but the Toyota Camry and Camry Hybrid have separate AMI billing, as the latter has substantial electrification. (“Substantial” is important; we judge milder hybrid applications, like the Jeep Wrangler’s eTorque V-6, as acceptable to fold into the parent vehicle’s ranking.)
Under our platform rule, vehicles like the Ram 1500 and Ram 1500 Classic are separate AMI entrants due to their different underlying architecture. By contrast, vehicles with different root nameplates are always distinct regardless of the architecture; the Chevrolet Colorado and GMC Canyon pickups have almost identical underpinnings, but since they have different names, they’re listed separately.
More From Cars.com:
- 2023 Cars.com American-Made Index: Which Cars Are the Most American?
- 2022 Cars.com American-Made Index: Which Cars Are the Most American?
- 2021 Cars.com American-Made Index: Which Cars Are the Most American?
- The Cars.com 2020 American-Made Index: Which Cars Are Most American?
How Your Unranked Car Still Counts
As it did in 2023, the Nissan Rogue concludes the ranked list — but that’s hardly where the story stops for the scores of vehicles that didn’t end up ranking. Among the 401 distinct light-duty models automakers sell (or plan to) in the U.S. for the 2024 model year, 134 are made solely in the U.S.; 252 are imported; and 15 are split between domestic and imported assembly lines. Only the middle group gets you disqualified from the jump, but other AMI stipulations cull vehicles from what makes the final list.
Even so, such imports and the unranked domestics DQ’d on other AMI grounds that join them significantly contribute to the economy beyond the 296,000-plus jobs that built light- and heavy-duty vehicles stateside in 2023. To wit: Some 577,000 additional jobs involve vehicle parts, and more than 1.3 million jobs are employed in dealership operations both for new and used vehicles. All together, employment in the car-shopping journey spans nearly 2.2 million jobs.
Then comes the work involved in helping those vehicles stay running. That includes 1.24 million jobs at independent repair shops; 602,000 jobs attributable to auto parts, accessories and tire stores; 387,000 jobs at wholesalers that include auction houses; and nearly a million jobs at gas stations. Ultimately, whether your car is made in the USA or imported from abroad, driving and servicing it helps contribute to an automotive industry that puts food on the table for some 5.4 million workers. Unranked doesn’t mean uncounted.
Cars.com’s Editorial department is your source for automotive news and reviews. In line with Cars.com’s long-standing ethics policy, editors and reviewers don’t accept gifts or free trips from automakers. The Editorial department is independent of Cars.com’s advertising, sales and sponsored content departments.

Patrick Masterson is Chief Copy Editor at Cars.com. He joined the automotive industry in 2016 as a lifelong car enthusiast and has achieved the rare feat of applying his journalism and media arts degrees as a writer, fact-checker, proofreader and editor his entire professional career. He lives by an in-house version of the AP stylebook and knows where semicolons can go.
Featured stories


